Results from 58 field-scale trials around Indiana since 2001 (45 since 2010) suggest that optimum plant populations for 30-inch row corn grown under typical yield levels and growing conditions are in the neighborhood of 31,400 PLANTS per acre (ppa) or seeding rates of about 33,000 SEEDS per acre (spa). The results further suggest that corn grown under challenging conditions (e.g., severe drought stress) may perform best at PLANT populations no higher than 25,500 ppa and perhaps as low as 21,000 ppa under truly severe growing conditions (actual drought, non-irrigated center pivot corners, non-irrigated sandy fields with minimal rainfall, etc.).
![]()
ne of the reasons that the topic of seeding rates is a popular one in coffee shops, Internet chat rooms, the farm press, and crop seminars is that variable rate seeding technology is becoming more and more commonplace today as a standard accessory on corn planters. Another factor that spurs the interest in corn seeding rates is the not uncommon belief that today’s hybrids will respond dramatically to aggressively high plant populations. The harvest populations often associated with national corn yield contest winning entries, coffee shop scuttlebutt, and encouragement from seed company marketing efforts fuel this belief.
Corn plant populations have been steadily increasing in Indiana for the past 25 years at approximately 300 plants per acre per year (Nielsen, 2013). In 2013, the estimated average plant population statewide (USDA-NASS, 2013) was approximately 30,400 PLANTS per acre (ppa). Considering stand establishment success ranging from 90% to 95%, this means that the average statewide seeding rate is probably between 32,000 and 33,800 seeds per acre (spa).
Statewide increases in plant population have occurred as growers have shifted from quite low seeding rates to intermediate and higher seeding rates. In 1998, nearly 46% of Indiana’s corn acres were estimated to have final stands less than 25,000 ppa and only 5% with final stands greater than 30,000 ppa (Nielsen, 2013). Whereas in 2012, only 14% of Indiana’s acres were reported to be less than 25,000 ppa and 50% of the acres were reported to be greater than 30,000 ppa. Among the changes that have allowed growers to steadily increase plant populations has been the genetic improvement in overall stress tolerance that has resulted in a) ear size and kernel weight becoming less sensitive to the stress of thicker stands of corn and b) improved late-season stalk health.
Field-Scale Seeding Rate Trials
Background on the trials
We began a more focused effort several years ago to evaluate yield response to seeding rates in field-scale trials at Purdue Ag. Research Centers and with growers around the state. To date, 58 such field-scale seeding rate trials have been completed.
The severe drought of 2012 offers an interesting insight into the relative risk of higher seeding rates for crops under severe stress. Consequently, the results of the 43 trials are presented separately in terms of the 31 trials from 2001 through 2011 and the 12 trials conducted in the droughty 2012 growing season.
These trials range in size from roughly 30 acres to 100 acres. Individual plot size is typically length of field by twice the width of the combine header. All of our trials to date have been on 30-inch rows, with the exception of a couple of twin-row trials. Most trials are planted using variable rate technologies and “prescription” seeding rate files developed prior to planting with GIS software. Commercial field equipment is used for all field operations. Harvest grain yields are typically estimated with GPS-enabled yield monitors and the yield data are processed with GIS software post-harvest to eliminate any significant non-treatment field variability (e.g., wet holes, gullies, planter skips, etc.). The statistical quality of the data from these field-scale trials is typically better than we could achieve with small-plot trials in the past.
A random assortment of hybrids has been used in the trials, but 13 trials were split-planter comparisons with pairs of hybrids purposefully chosen for their advertised responsiveness to population. Most of the trials have also been conducted at the farmer’s normal nitrogen (N) fertilizer rate. However, 7 trials evaluated yield response to normal and higher than normal N rates.
Overall field productivity levels of the trials have ranged from less than 100 bushels per acre (bpa) to nearly 250 bpa. Twelve of the 58 trials can be characterized as “severely stressed”, most of which occurred during the severe drought conditions of 2012. These offer an interesting insight into the relative risk of higher seeding rates for crops under severe stress. Consequently, the results of the 58 trials are presented separately in terms of the 46 trials that can be characterized as “normal” productivity (moderate or less stress) and the 12 trials characterized as having experienced “severe” stress (mostly drought).
Final stand or harvest population is rarely equal to the number of seeds that were planted per acre due to germination and/or emergence problems plus plant mortality throughout the season. Percent stand (final population divided by seeding rate) in our 58 trials averages 95%, but ranges from as low as 81% to as high as 100%. Therefore, yield response to seeding rates is more appropriately analyzed and presented in terms of yield response to PLANT populations.
Growers should routinely count plants and calculate percent stand in all their fields every year to determine whether there is room for improvement. With today’s planter technologies and seed quality, aiming for a percent stand of no less than 95% is certainly achievable. Equally important is that the knowledge of your historical percent stand allows you to convert recommended final PLANT populations to SEEDING rates.
Example: If the recommended PLANT population is 30,000 and your historical percent stand is 95%, then the targeted SEEDING rate would be 30,000 divided by 0.95 or 31,579 SEEDS per acre.
Results of the trials
“Normal” Growing Conditions. For the 46 trials characterized as experiencing a normal range of growing conditions (moderate to low stress), maximum grain yield occurred at an average PLANT population of 31,400 ppa. On the basis of a percent stand of 95%, that would translate to a SEEDING rate of about 33,000 spa.
Optimum PLANT populations varied among the 46 trials from just over 24,000 to just under 44,000 ppa (Fig. 1). However, optimum PLANT populations for 74% of the trials ranged from 28,000 to 35,000 ppa.
For the 46 trials characterized as experiencing a normal range of growing conditions (moderate to low stress), there was no relationship between yield level and optimum plant population even though optimum yields varied from 121 to 245 bpa (Fig. 1). This result suggests, that if spatial variability for productivity within a specific field was similar to this range, there may be minimal value to variable rate seeding.
Severe Stress Conditions. The average optimum PLANT population for the 12 severely stressed (mostly drought) trials was 25,500 ppa or about 6,000 fewer ppa than those trials that experienced more “typical” growing conditions. At 95% stand establishment rate, the 25,500 PLANT population would equal a SEEDING rate of about 26,800 spa. Among the individual trials, optimum PLANT populations ranged from 20,400 to 33,000 ppa and optimum yields ranged from 71 to 168 bpa (Fig. 2).
Hybrid Differences. Thirteen of the 58 trials included targeted comparisons of paired hybrids characterized as “less” or “more” responsive to plant populations with the objective to document whether or not such advertised hybrid population “ratings” resulted in significantly different optimum plant populations. Of the 13 such trials, only 3 resulted in significant hybrid differences in yield response to population (Fig. 3). Of these, optimum populations for the “less” responsive hybrids were higher than for the “more” responsive hybrids in two of the trials (opposite of expectation), but the differences in optimum population were only about 1,000 ppa (Fig. 3). In the third trial that exhibited significant hybrid differences for optimum population, maximum yield for the “more” responsive hybrid did indeed occur approximately 4,600 ppa higher than for the “less” responsive hybrid, (Fig. 3). However, the latter pair of hybrids was also evaluated at three other locations and they did not respond differently to population (data not shown).
Effect of Nitrogen (N) Fertilizer Rate. Seven of the 58 trials included both the farmer’s normal N rate and a rate from 50 to 75 lbs higher than his normal rate with the objective of determining whether yield response to plant population might be influenced by N availability. However, optimum plant populations were not influenced by N rate in any of these 7 field trials (data not shown).
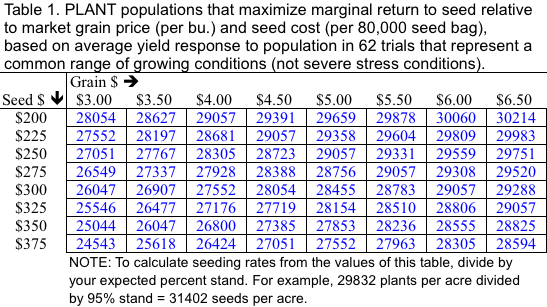
Economics. This summary has focused on “agronomic” optimum populations that result in maximum grain yield. Clearly, your market price for grain and the cost of seed influence the estimation of an economically optimum seeding rate. Table 1 provides such estimates based simply on a range of grain prices and seed costs, using the average grain yield response in the 46 trials that represent “typical” growing conditions.
Recognize that percent stand establishment also influences the calculation of economic optimum seeding rates. If percent stand in your fields is historically lower than desired, then you either need to figure out how to improve the success of stand establishment or you need to use a higher seeding rate just to achieve the desired economically optimum final stand and, therefore, incur even more seeding cost.
Summary
Results from 58 field-scale trials around Indiana since 2001 suggest that optimum plant populations for corn grown under typical yield levels and growing conditions are in the neighborhood of 31,400 ppa or seeding rates of about 33,000 spa. The results further suggest that corn grown under severely stressful conditions may perform best at plant populations no higher than 25,500 ppa and perhaps as low as 21,000 ppa under truly severe growing conditions (actual drought, non-irrigated center pivot corners, non-irrigated sandy fields with minimal rainfall, etc.). Economic optimum plant populations are several thousand ppa less than agronomic optimum plant populations, the magnitude of the difference being dependent on grain price and seed cost.
There is limited evidence from these trials that hybrids characterized as “more” responsive to population respond any differently to seeding rate than hybrids characterized as being “less” responsive to population. There is also no evidence from these trials that N fertility level influences yield response to seeding rate.
On-Farm Field-Scale Seeding Rate Trials: We Need Your Help!
The 58 field-scale trials that are summarized in this report were scattered throughout the state and represent a wide range of growing conditions. However, there is a need for even more such trials to better “capture” the effects of different growing conditions, hybrids, and N fertilization on yield responses to plant population. Field-scale on-farm seeding rate trials are simple to conduct if your planter is equipped with GPS-enabled variable rate controls because we can create a “prescription” file for the trial that “tells” the VR controller where to automatically change seeding rates during planting. With a bit more effort, on-farm seeding rate trials can also be conducted without variable rate controls.
We encourage you to consider collaborating with us to conduct field-scale seeding rate trials on your farm. These trials can be customized to include two or more nitrogen fertilizer rates or multiple hybrids. Such trials will help you better identify the “ballpark” optimum plant populations for your conditions and can also be used to evaluate yield response to plant population in different areas or “zones” within fields to help address the question about the relative merits of variable rate seeding.
If you would like to participate in one or more on-farm seeding rate trials with corn, please download the protocol for this at the following URL and contact Bob Nielsen (rnielsen@purdue.edu) for additional information.
http://www.agry.purdue.edu/ext/ofr/protocols/PurdueCornSeedingRateProtocol.pdf
Acknowledgements
The field-scale research summarized in this update has been supported, in part, by funds from the Indiana Corn Marketing Council, the Purdue Mary S. Rice Farm Fund, and the Indiana Certified Crop Adviser Program. The generous donation of seed corn by Stine Seed Company for our 2013 field trials at four Purdue Ag. Research Centers is gratefully acknowledged. Finally, the collaboration of the participating farmers, crop consultants, retail agronomists, county Extension Educators, and Purdue Ag. Research Center personnel is gratefully acknowledged.
Related reading
Nielsen, RL (Bob). 2013. Thoughts on Seeding Rates for Corn. Corny News Network, Purdue Extension. Online at http://www.kingcorn.org/news/timeless/SeedingRateThoughts.html [accessed Dec 2013].
USDA-NASS. 2013 (Nov 8). Crop Production. USDA – Nat’l Ag. Statistics Service, Washington, D.C. Online at http://usda01.library.cornell.edu/usda/nass/CropProd//2010s/2013/CropProd-11-08-2013.pdf [URL accessed Dec 2013].
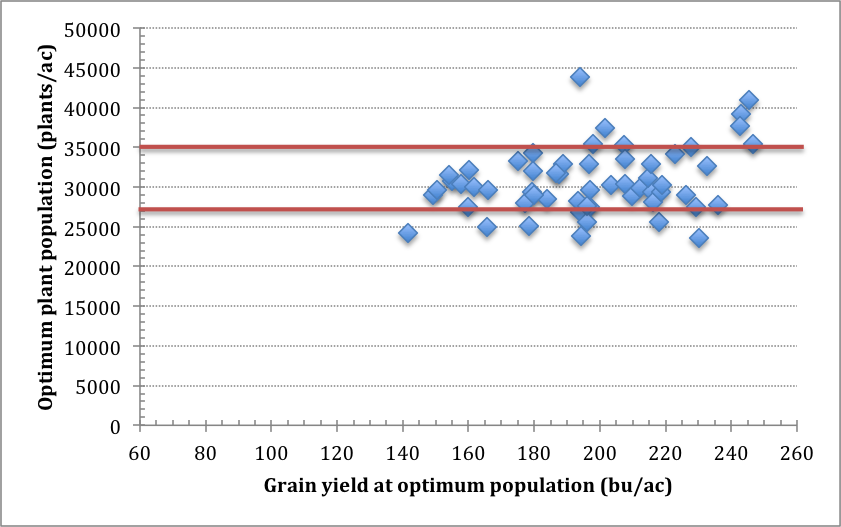
Fig. 1. Optimum plant populations versus optimum grain yield for each of 46 field-scale seeding rate trials across Indiana characterized as
experiencing a normal range of growing conditions (moderate to low stress), 2001 – 2013. The average optimum plant population was 31,400 ppa
and 74% of the individual trial optimum plant populations were between 28,000 and 35,000 ppa (indicated by dark lines on graph).
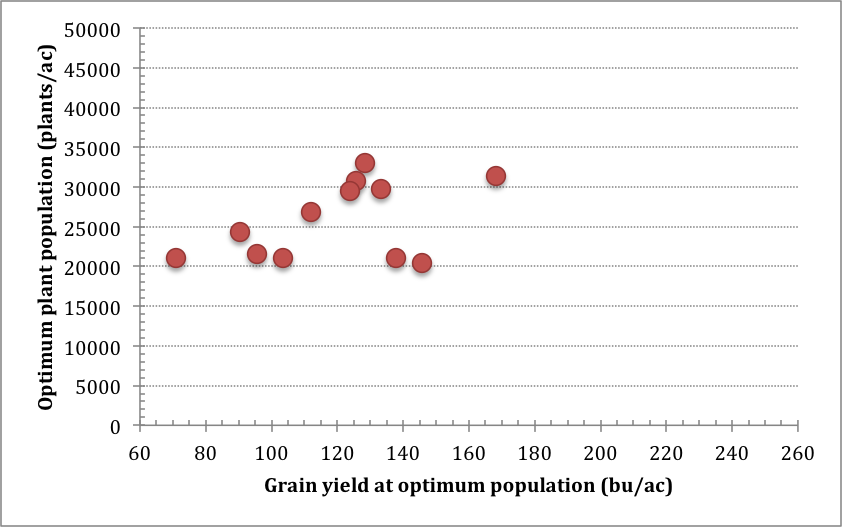
Fig. 2.Optimum plant population versus optimum grain yield for each of 12 field-scale seeding rate trials across Indiana characterized as
being severely stressed, 2011-2013. The average optimum plant population for these severely stressed trials was 25,500 ppa and ranged
from 20,400 to 33,000 ppa.
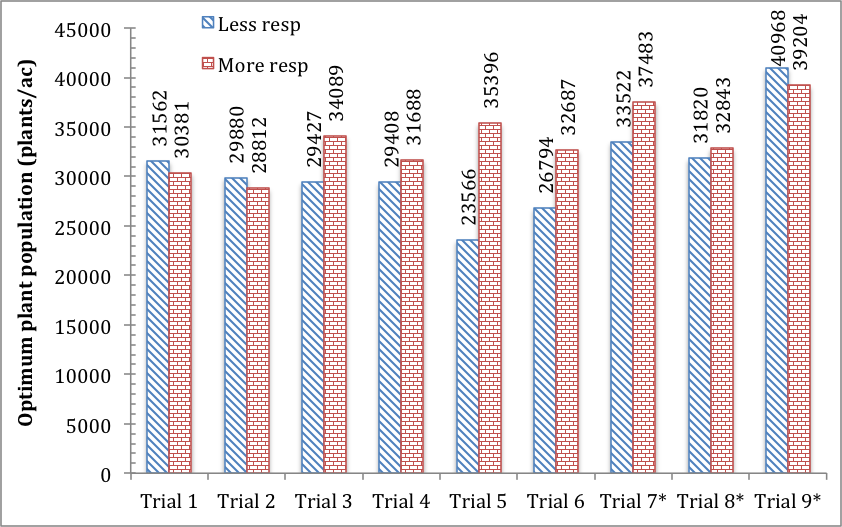
Fig. 3. Three trials that resulted in significant differences between paired hybrids characterized by seed companies as being less
responsive (less resp) and more responsive (more resp) to plant population. Each trial represents a different pair of hybrids. The
value atop each bar is the optimum plant population for the hybrid. None of the other 10 paired-hybrid trials exhibited any hybrid
difference for optimum plant population.